Press Enter

Temperature mapping is one of those things that sounds simple on paper: place sensors, collect data, review results. But in reality, there’s a bit more to it. In industries governed by Good Distribution Practices (GDP) and Good Manufacturing Practices (GMP), temperature mapping is not just best practice, it’s an expectation.

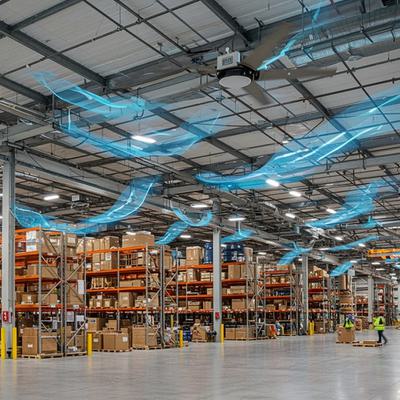
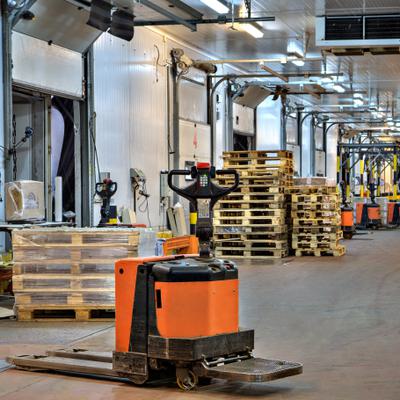
When done properly, temperature mapping is an essential step in maintaining proper environmental conditions in warehouses, storage areas, and regulated environments. It helps identify temperature variations, validate storage areas, and ensure that sensitive products remain within required limits.

But even with the best intentions, temperature mapping studies can sometimes miss the mark. Small oversights in planning or execution can lead to incomplete data, inaccurate conclusions, or the need to repeat the study altogether.

Let’s take a look at some of the most frequent temperature mapping missteps, and how to avoid them.

1. Using Too Few Sensors

If temperature mapping had a “most common mistake” award, this would likely win it.

It’s tempting to keep things simple and place only a handful of sensors throughout a space. Unfortunately, temperature doesn’t always behave so predictably and can vary significantly within a facility. Factors such as airflow patterns, building layout, sunlight, equipment, and even rack replacement can create localized hot or cold spots. If sensors are spaced too far apart, these variations may go undetected.

How to avoid it:
Distribute sensors through a risk-based approach across the entire storage area.  This includes different zones, corners, and potential risk areas. The goal is to capture the full environmental picture; not just the easy-to-reach parts.

Warehouse airflow
Heat Rises Thermometer Icon

2. Forgetting That Heat Rises

It’s basic physics, but it’s surprisingly easy to overlook during a mapping study.

Warm air rises, which means the temperature at the top rack level can be significantly different from the temperature near the floor. If all sensors are placed at one height, those vertical variations can go completely unnoticed.

In other words, the bottom shelf might look perfectly fine while the top shelf is experiencing a very different climate.

How to avoid it:
Place sensors at multiple heights, such as near the floor, mid-rack, and upper rack levels. This approach helps create a more accurate picture of temperature distribution throughout the storage space.

3. Not Accounting for Operational Activity

A temperature mapping study conducted in a perfectly still warehouse may look great on paper. The problem? Warehouses are rarely still.

Doors open. 

Forklifts move in and out. 

Products are loaded and unloaded. 

All of these activities influence airflow and temperature conditions throughout the space. If operational activity isn’t considered during the study, the results may not accurately reflect day-to-day conditions.

How to avoid it:
Conduct temperature mapping during normal operating conditions whenever possible. Record key activities such as door openings or major workflow changes so the data can be interpreted correctly.

Forklift loading dock
Downtime

4. Running the Study for Too Short a Time

Temperature changes don’t always show up right away. Some variations only appear over time as HVAC systems cycle, outside temperatures shift, or daily operations fluctuate.

A short mapping study might capture a snapshot, but miss the bigger picture.

It’s a bit like checking the weather once and assuming the rest of the week will be the same.

How to avoid it:
Allow enough time to capture meaningful data. Many studies run for several days to ensure that temperature variations across different times of day are properly recorded.

5. Ignoring Seasonal Temperature Extremes

Environmental conditions can change dramatically throughout the year. A storage space that performs well during mild weather may experience significant temperature variation during peak summer heat or winter cold.

Seasonal conditions can put additional stress on HVAC systems and introduce new temperature variations that weren’t present during previous studies.

If mapping is only conducted once, these seasonal extremes may never be captured.

How to avoid it:
Many facilities perform mapping studies during the warmest and coldest times of the year. This helps confirm that the storage environment remains within acceptable limits under the most challenging conditions year-round.

Longevity
Cost management

6. Skipping Documentation and Data Review

Collecting temperature data is only one part of the process. The real value comes from reviewing the data, documenting findings, and identifying potential improvements. 

Without proper documentation and review, it becomes harder to demonstrate compliance, explain results, or learn from the study. Incomplete records or poorly organized data can also create challenges during audits or regulatory reviews. And let’s be honest… no one enjoys digging through poorly labeled data files during an audit.

How to avoid it:
Ensure that the study is fully documented, including sensor placement, mapping duration, and operational conditions during the test. Reviewing the data carefully helps identify trends, potential problem areas, and opportunities for improvement.

7. Failing to Re-Map After Changes

Temperature mapping isn’t a one-and-done exercise; especially in environments that don’t stand still. Temperature distribution can change significantly after modifications to a facility or operation.

Even small changes to your facility can have a ripple effect on temperature distribution. HVAC system changes, Layout or racking adjustments, new equipment installation, changes in workflow or storage volume, are all common triggers that could suddenly shift airflow patterns in ways you didn’t expect.

How to avoid it:
Repeat temperature mapping whenever significant changes occur that could impact environmental conditions. If something has changed, it’s worth confirming your environment still performs the way you think it does.

Safety First
Quality control

8. Using Uncalibrated or Inaccurate Sensors

Even a perfectly designed study can fail if the sensors themselves are unreliable.

Uncalibrated or poorly calibrated sensors can produce inaccurate data, leading Using uncalibrated or poorly calibrated sensors can lead to misleading results, false confidence, and potential compliance headaches down the line. It’s a classic case of “everything looks fine”…until it isn’t.

How to avoid it:

Use calibrated sensors with valid certificates and ensure calibration is traceable to recognized standards to ensure accuracy and reliability. At the end of the day,  accurate data starts with accurate instruments.

Setting Your Temperature Mapping Study Up for Success

Temperature mapping doesn’t have to be complicated, but it does require thoughtful planning.

A successful temperature mapping study provides valuable insight into how your facility performs under real-world conditions. By avoiding these common mistakes, you can collect more reliable data and gain a clearer understanding of your storage environment.

With warmer temperatures approaching, now is an ideal time to review your mapping plans, check your equipment, and ensure your facility is ready for seasonal monitoring.

Because when it comes to temperature mapping, a little preparation today can prevent a lot of surprises later.